
In 2023, a UK-based fashion retailer made a decision that would have been unthinkable five years earlier: they closed 23 stores and didn’t replace them.
It wasn’t because of e-commerce competition. Their online channel was growing normally. The reason was occupancy data—a year of granular foot traffic data from their in-store lighting sensors showed that 40% of their physical locations were operating below the threshold where brick-and-mortar presence made financial sense.
This is the real story of occupancy analytics in retail. Not the technology story. The money story.
The Data That’s Been Sitting There All Along
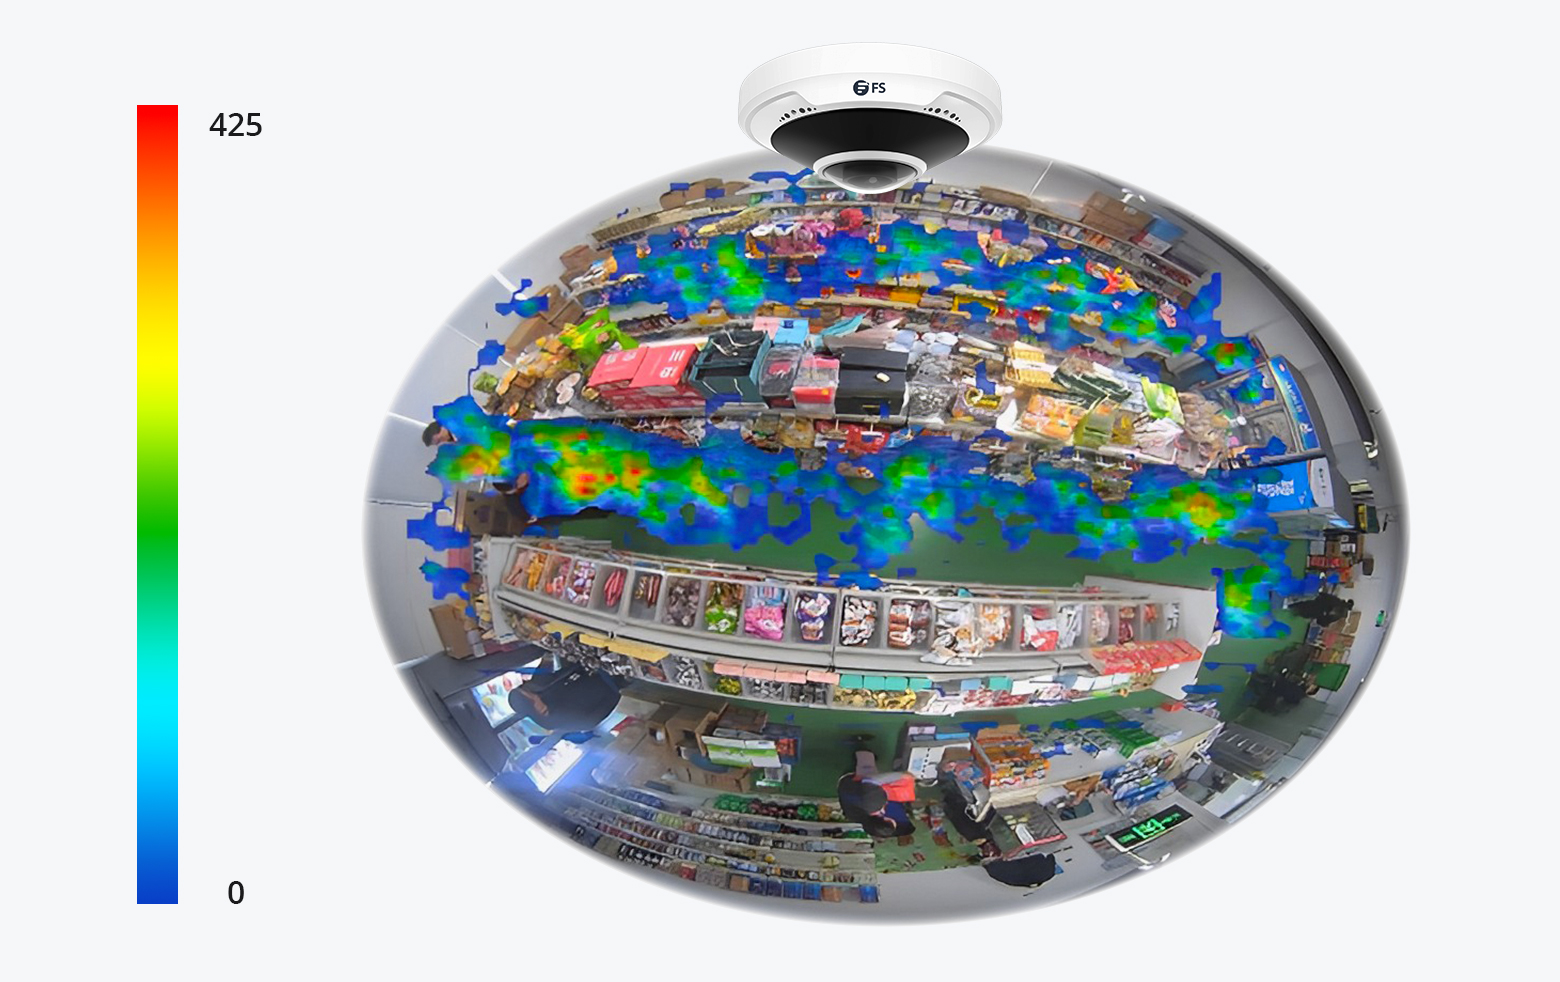
Modern smart lighting systems generate an enormous amount of data about how people move through space. Each luminaire with an integrated occupancy sensor records timestamped presence events. Multiply that by hundreds of fixtures across a store, by hundreds of stores, by 365 days, and you have a dataset that can fundamentally change how retail real estate decisions get made.
The problem is that most retailers have been treating this data as a lighting control signal—”dim the lights when nobody’s in the zone”—rather than as a business intelligence asset.
That mentality is starting to shift. I’ve spoken with real estate teams at six major retail chains over the past year. Four of them are now actively using occupancy analytics from their lighting systems to inform lease negotiations, store format decisions, and expansion planning. Two are still trying to figure out how to access the data their existing systems are already collecting.
What Occupancy Data Actually Reveals
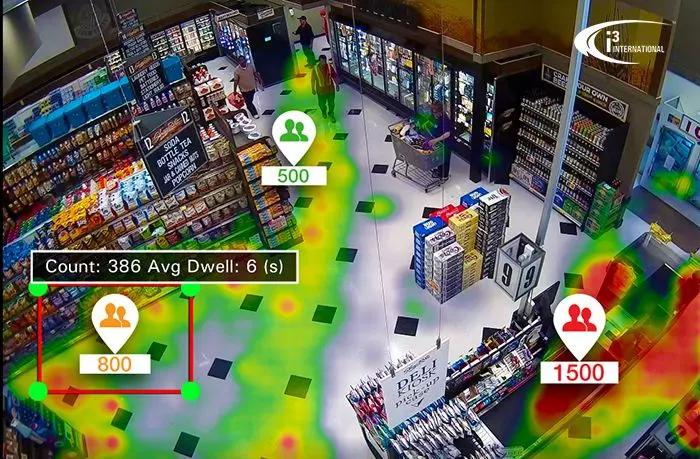
Raw footfall counts are useful. But the real value comes from the derived metrics—metrics that require good data and analytical sophistication to generate.
Trade area analysis: Which stores attract customers from their stated trade area versus which ones pull from a different demographic or geographic profile? If you’re paying premium rent for a location that’s primarily serving customers who would shop at your cheaper location three kilometers away, you’re wasting money.
Format optimization: How does occupancy density vary by time of day, day of week, and season? A store that peaks at noon on Saturdays needs a different format than one that peaks Wednesday evenings. Understanding these patterns affects everything from staffing to inventory to fixture density.
Conversion funnels: How many people enter the store versus how many make a purchase? This isn’t just about conversion rate—it’s about identifying where in the customer journey friction occurs. If 500 people enter daily but only 40 buy, the issue might be merchandise, staff engagement, or store flow, and occupancy data helps isolate the cause.
Lease negotiation leverage: Here’s the dirty secret of retail occupancy analytics: it’s devastating leverage in lease negotiations. If you can show your landlord that foot traffic has declined 30% since your lease was signed, and you have timestamped data to prove it, you’re in a very different negotiating position than if you just say “traffic is down.”
The ROI Calculation Nobody’s Doing
Let me give you a concrete example of what this looks like in practice.
A regional supermarket chain I worked with in 2024 was paying an average of $28 per square foot annually across 87 locations. Their smart lighting system—CAIMETA, as it happens—had been collecting occupancy data for 18 months. They asked me to help them analyze it.
What we found: 34 of their locations were generating less than 40% of the occupancy density of their top quartile stores. At those locations, the theoretical maximum sales per square foot was fundamentally constrained by insufficient foot traffic, regardless of merchandising, staffing, or pricing improvements.
Lease negotiations were coming up for 12 of those 34 underperforming locations within the next 18 months. Using their occupancy data as leverage, they negotiated rent reductions averaging 22% at 9 of those locations. At two locations where the landlord wouldn’t negotiate, they closed the store entirely.
Total annual savings: $1.4 million. The data infrastructure investment to enable this analysis was the existing lighting system plus about 40 hours of analytical work.
That’s the ROI calculation that should be on every retail real estate team’s spreadsheet.
The Implementation Reality
Here’s what I’ve learned about actually getting value from occupancy analytics: the technology is rarely the constraint. The constraint is usually data integration and analytical capability.
Most lighting systems export occupancy data in proprietary formats or through APIs that require custom integration. Getting this data into a format where it can be analyzed alongside sales data, lease terms, and demographic information requires some engineering work.
The analytical work is where the value actually gets created. Raw occupancy counts aren’t that useful. What you need is:
Normalized metrics: Occupancy as a percentage of store capacity, not absolute counts. This accounts for store size variation across your portfolio.
Temporal alignment: Occupancy data correlated with sales data by time period. You need to be able to ask “what were sales per visitor in the 2-4pm window at this location versus that location?”
External data integration: Weather, local events, economic conditions. A 40% occupancy drop on a rainy Tuesday is different from a 40% drop when weather was normal.
Portfolio benchmarking: Each store compared against its relevant peer group. A flagship location in a shopping center should be benchmarked differently than a neighborhood convenience format.
What Smart Lighting Vendors Should Be Offering
The lighting industry is gradually waking up to the fact that occupancy data has value beyond lighting controls. But most vendors are still treating it as a secondary feature rather than a primary value proposition.
What you should expect from a smart lighting vendor in 2026:
Standard data export: Occupancy data should be exportable in standard formats (CSV, JSON, API) without proprietary software or per-query fees.
Benchmarking data: Ideally, your vendor aggregates anonymized data across their installed base so you can benchmark your stores against industry averages. This requires careful privacy handling, but it’s technically feasible.
Integration support: Pre-built connectors to common retail analytics platforms, POS systems, and lease management tools. If every customer has to build custom integrations, the data asset remains underutilized.
CAIMETA’s platform includes API access to occupancy data and pre-built reporting that generates the derived metrics I described above. They’re not the only vendor moving in this direction, but they’re ahead of most in terms of making the data actually usable.
The Decision Framework
If you’re running a retail chain with more than 20 locations and you’re not actively using occupancy analytics from your lighting system, here’s the decision framework I’d recommend:
First: Determine whether your current lighting system collects occupancy data. If yes, find out how to export it. If no, make occupancy data collection a requirement in your next lighting specification.
Second: Calculate the total annual rent across your portfolio. Even a 5% reduction through better lease negotiation leverage would be worth significant money. Now estimate how many analyst hours it would take to extract and analyze this data—likely 40-80 hours. The ROI is almost always positive.
Third: Identify your highest-rent locations and analyze their occupancy trends over the past 24 months. These are your highest-leverage lease negotiations.
The fashion retailer I mentioned at the start? They saved $8.2 million annually by using occupancy data to optimize their store footprint. The data was being collected by their lighting system all along. They just started using it.
Your lighting system is a real estate intelligence asset. Time to treat it that way.
CAIMETA® provides AI-powered commercial lighting with integrated occupancy analytics. Their platform generates standardized occupancy metrics and supports portfolio-level benchmarking. Request a data audit to assess what your current lighting infrastructure could be telling you about your real estate performance.